How To Easily Add Website Color Charts Using Google Charts [VIDEO]
In this article I'm going to show you how to leverage Google Charts on your Duda website. It's easier than you might think AND if your website needs to display data along with charts or graphs, I highly recommend you embed a Google Chart rather than simply uploading a screenshot or image of a chart. (Video walkthrough at the bottom.)

Hi, I'm Tom Connery, and I build websites for digital marketing agencies and small businesses on the Duda platform? What's Duda? It's the secret web design platform that many agencies use to provide responsive and affordable websites for their clients.
Before I get started, I want to shout out and thank all of the new members of the Learn Duda Community. That's Jeremie, Ewhyn, Kathryn, Cara, Harvey, Todd, Max, Lacey, Brian, Raj, Leighton, Ramy, and more! If you're curious about learn duda, please visit community.learnduda.com where my goal is to support and promote Duda as a website builder. Learn Duda is all about education and support to help people with Duda website building.
So, google charts or graphs - what is it?
Google chart tools are powerful, simple to use, interactive, and free.
The charts are based on pure HTML5/SVG technology where NO PLUGINS are required in order to display them. Charts can be dynamic as you can ingest data from Google Sheets as well as from other sources. And what I love about it, is you're using code to embed data and information that's interactive. Not only is this better from a user experience perspective, but it's google code! Do you think google chart data might help in ranking if you're trying to communicate specific data points or information that people are searching for? Sure, it should. And it has to be better than simply uploading a screenshot of an Excel chart or some other image and using only an alt image tag to describe what the user is seeing.
Let's add a simple Google chart. Please note that in this walkthrough, you'll need to access dev mode in Duda ( look for the </> icon ) where we'll be making additions to the home-head-section.html file. We will also be going into the dev editor for the HTML widget.
In order to leverage Google Charts, you'll need to add some script code to the head section for whatever page is going to have Google Charts embedded within them. In my example, we're using the home page of the website.
First, you'll need to copy/paste the loader script into your page header. This is the same no matter what type of chart you want to use. Please click the </> icon or button now up toward the right side of the Duda header or top row menu to enter Dev Mode.
Copy/Paste:
<script type="text/javascript" src="https://www.gstatic.com/charts/loader.js"></script>
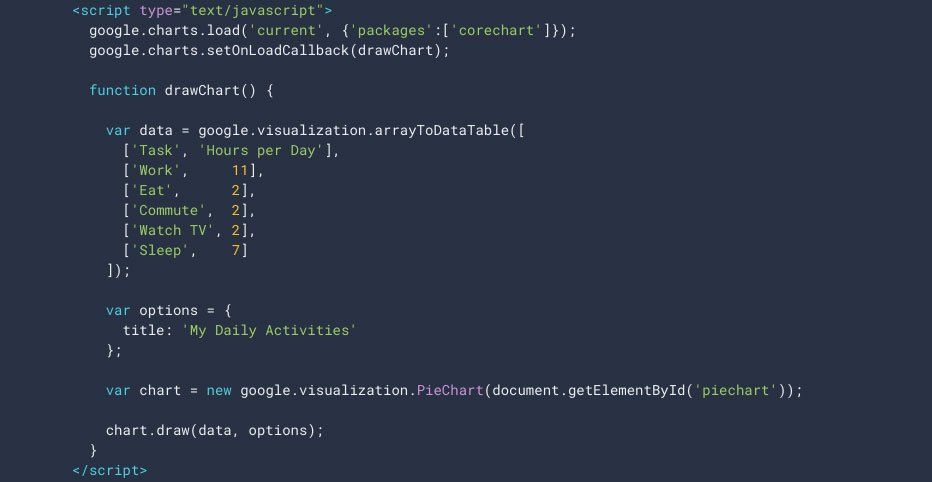
Next, you'll want to locate or identify a chart that you'd like to initially embed or test with. In my example, I'll use a Google's basic pie chart .
Click on the pie chart page and you'll see another script that you'll need to embed in the page header. Note, you do not need to include the loader script more than once so leave that code at the top of the header.
For this second snippet of code, you only need to copy/paste the script portion just below the loader.js line. Check it out in the example below:
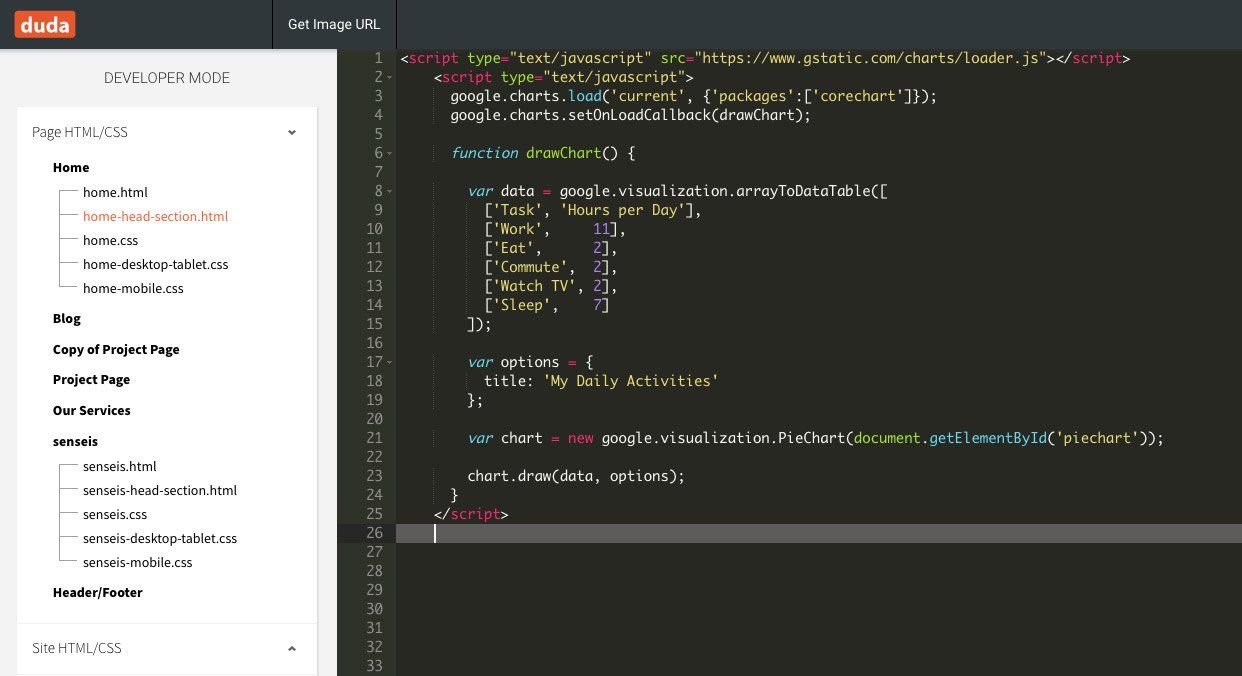
At this point, you should have copied and pasted two separate scripts into the page header. These are required in order for the chart to load properly. You can now optionally modify the chart's variables if you want to replace Task, Work, Eat, etc as well as it's associated numeric value. The screenshot below shows what you should see in Duda.
How To Display Your Google Chart In Duda
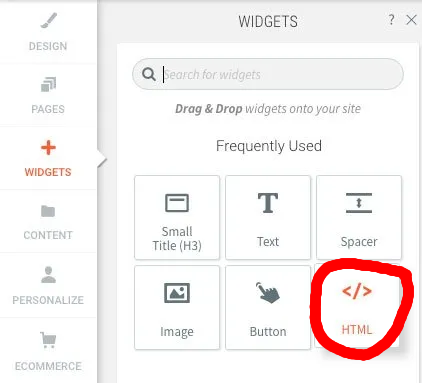
Ok, finally - let's add an html widget so we can embed our custom chart. Using the left-side menu in Duda, locate the HTML widget and drag it onto the screen where you'd like to embed the Google Pie Chart.
LEAVE the default 'Add your custom HTML here' text in the html widget. What we need to do instead, is locate the div ID of the container. We're going to completely ignore the text or code in the widget and instead, tell the container to load the Google Chart.
Click the "Dev Mode" oval shaped button in the bottom left corner of the HTML widget. Once in dev mode, get the id="" value for the HTML container or widget you just added. The dark grey highlighted line is the one you want to use! Copy and paste this id value to a temp notepad or textedit file or make note of it somewhere if you need to. I'm just going to copy/paste it.
Now, go back into dev mode for the entire site and access the page's specific header html again. We are using home-head-section.html in this example. Locate the var or variable line where getElementById('piechart') is located. Simply paste in your div ID to replace the word 'piechart' but keep the single quotes there!
The below is an example id for a specific html div.
Click Save and go test out your chart!


There you have it folks. Get out of dev mode and go test out your page in preview mode. Your Google Chart should now render properly! I hope this article has helped you with how to add website color charts to your Duda website. If this post did help you, please leave a comment below and let me know. It would also mean the world to me if you shared this article with anyone who might benefit from this information on Google Charts.
OH and finally, if you are new to Duda and would like to sign up for their free trial please consider using my affiliate link where I would receive a small commission ONLY if you did end up purchasing and publishing a plan or website. It's complete free to try for 14 days.
Prefer a video walkthrough instead? Checkout my Google Charts video on YouTube!

Hi, I'm Tom! I help agencies and small businesses with Duda website design, local SEO, and support. On the Ayni Media blog, I create content that helps people discover Duda as well as other website and digital marketing services. Need help with Duda? Hire a Duda Expert today.


*Start your free trial using the above image link and then be sure to use my unique Duda website coupon code, TOM10 to save 10% on your activation. This discount works for White Label and Agency plans only - Thank you!